RIR2602
Latvia has a population of 1.845 million
According to the Central Statistical Bureau (CSB), population of Latvia stood at 1 million 845 thousand at the beginning of 2026, with the working-age population accounting for 62.8 %. Children aged 14 and under made up 14.8 % of the total population, with the greatest proportion of them registered in Riga region. Migration data show that the population of Riga region keeps growing. The proportion of Latvians is also increasing, as is the number of citizens of Latvia.
Since 2025, CSB population statistics have been based on a new method 1 that estimates the probability of a person being a usual resident of Latvia and evaluates activity recorded in selected administrative registers (signs of life).
At the beginning of 2026, 62.8 % of the total population were of working age (15–64 years), and their share has reduced by 0.2 percentage points compared with the beginning of 2025. Population of older people (65 years and over) increased by 0.5 percentage points and made up 22.4 % of all inhabitants, while the population of children (14 years and under) decreased by 0.3 percentage points, totalling 14.8 %.
The mean age of the population in Latvia is 43.7 years, ranging from 42.8 years in the Riga region to 46.3 years in Latgale region.
Compared with the beginning of 2025, the population of Latvia has declined by 0.83 % or by 15.5 thousand people. This is the smallest year-on-year population decline recorded in the past three years. As a result of negative natural population change, with deaths outnumbering births, the total population declined by 0.76 % or 14.2 thousand people. In addition, negative net migration – with more people leaving the country than entering – led to a decrease of 0.07 % or 1.3 thousand people.
In 2025, 11 931 children were born in Latvia, a decrease of 956 children or 7.4 % year on year.
With 26 109 deaths registered in 2025, mortality has reduced. Compared with 2024, the figure has gone down by 552 deaths or 2.1 %.
Demographic trends in Latvia, 2023–2025
| 2023 | 2024 | 2025 | 2024/2023, % | 2025/2024, % | per 1 000 inhabitants | ||
| 2024 | 2025 | ||||||
| Marriages | 10 549 | 10 205 | 10 457 | -3.3 | +2.5 | 5.5 | 5.6 |
| Divorces | 5 312 | 5 328 | 5 111 | +0.3 | −4.1 | 2.8 | 2.8 |
| Births | 14 490 | 12 887 | 11 931 | −11.1 | −7.4 | 6.9 | 6.4 |
| Deaths | 28 031 | 26 661 | 26 109 | −4.9 | −2.1 | 14.3 | 14.1 |
| Immigration | 15 629 | 14 701 | 13 826 | −5.9 | −6.0 | 7.9 | 7.5 |
| Emigration | 18 752 | 18 937 | 15 117 | +1.0 | −20.2 | 10.1 | 8.2 |
Last year, 13.8 thousand people arrived and 15.1 thousand left the country
In 2025, 13.8 thousand people arrived 2 in Latvia – 875 (6.0 %) fewer than in 2024. Out of all immigrants, 3.3 thousand people (24.2 %) came from the EU countries (down by 16.1 % year on year), with the majority of them coming from Germany (739 or 22.1 %). Immigrants from the EU candidate countries accounted for 3.3 thousand (24.1 %), including 2.8 thousand from Ukraine, those from the United Kingdom made up 2.2 thousand (15.5 %), from Russia 1.5 thousand (10.9 %), and from India 994 (6.8 % of all immigrants).
Additionally, 15.1 thousand people left Latvia – 3 820 (20.2 %) fewer than in 2024. Out of all emigrants, 8.3 thousand (54.6 %) went to the EU countries (down by 4.7 % year on year), with the majority of them going to Germany (2.3 thousand or 14.9 %). EU candidate countries were a destination of 2.9 thousand (19.1 %) emigrants (down by 2.0 thousand or 41.3 % compared with 2024), 2.9 thousand (18.9 %) went to Ukraine, and 1.4 thousand (9.3 %) to the United Kingdom.
At the beginning of 2026, 17.2 thousand war refugees 3 from Ukraine lived in Latvia (17.5 thousand at the beginning of 2025).
Remigrants, i.e., citizens or non-citizens of Latvia as well as inhabitants having different citizenship but born in Latvia, accounted for 7.6 thousand people and made up 55.1 % of all immigrants. Compared with 2024, the number of remigrants has reduced by 2.4 thousand, while their share in the total immigration fell by 12.7 percentage points.
Riga and Zemgale regions have the highest proportion of children
The greatest proportion of children and adolescents (0–14 years) in the total population of the respective region was registered in Riga and Zemgale regions – 15.3 % in each. In other regions, it ranged from 15.0 % in Vidzeme to 12.5 % in Latgale. The share of children in State cities varied between 16.9 % in Jelgava and 13.3 % in Daugavpils and Jūrmala. With one in four inhabitants being a child aged 14 and under (24.7 % of the total population in municipality), Mārupe was the youngest municipality, whereas Krāslava and Augšdaugava had the smallest proportions of children – only 9.5 % and 10.7 % respectively.
The share of people of working age (15–64 years (incl.)) varied between 63.5 % in Riga region and 62.0 % in Kurzeme region. Among the State cities, the share of working-age population ranged from 63.3 % in Riga to 60.6 % in Ventspils. The smallest proportion of population at this age was recorded in Valka municipality (58.6 %), whereas the largest in Rēzekne municipality (64.9 %).
With one in four residents (25.3 %) aged 65 or older, Latgale region has the greatest share of older population, whereas Riga region, with one in five residents at this age, has the smallest proportion of elderly (21.2 %). Among the State cities, the largest share of elderly population was recorded in Ventspils (25.6 %) and Daugavpils (25.5 %), while the smallest in Jelgava (20.8 %). As for municipalities, Krāslava and Valka have the greatest proportions of older people – 28.6 % and 27.4 % respectively, whereas Mārupe the smallest – 11.0 %.
Share of Latvians has increased
At the beginning of 2026, the share of Latvians in the total population went up by 0.3 percentage points and reached 63.8 % (63.5 % at the beginning of 2025). However, population decline was recorded among Russians and Belarusians (down by 0.2 and 0.1 percentage points respectively), while the share of Ukrainians, Poles and Lithuanians remained unchanged.
Out of the total population, 88.6 % were born in Latvia and 11.4 % abroad. Those born in the EU countries accounted for 1.1 %, in Russia for 4.8 %, in Ukraine for 2.3 %, and in Belarus for 1.8 %. Out of the children (17 years and under), 95.0 % were born in Latvia, followed by 1.5 % born in the United Kingdom and 1.4 % born in Ukraine.
In terms of citizenship, 87.9 % of the population were formed by citizens of Latvia (up by 0.2 percentage points year on year), 8.7 % by non-citizens of Latvia (down by 0.2 percentage points), and 3.4 % by citizens of other countries (of which, 27.4 % were refugees from Ukraine).
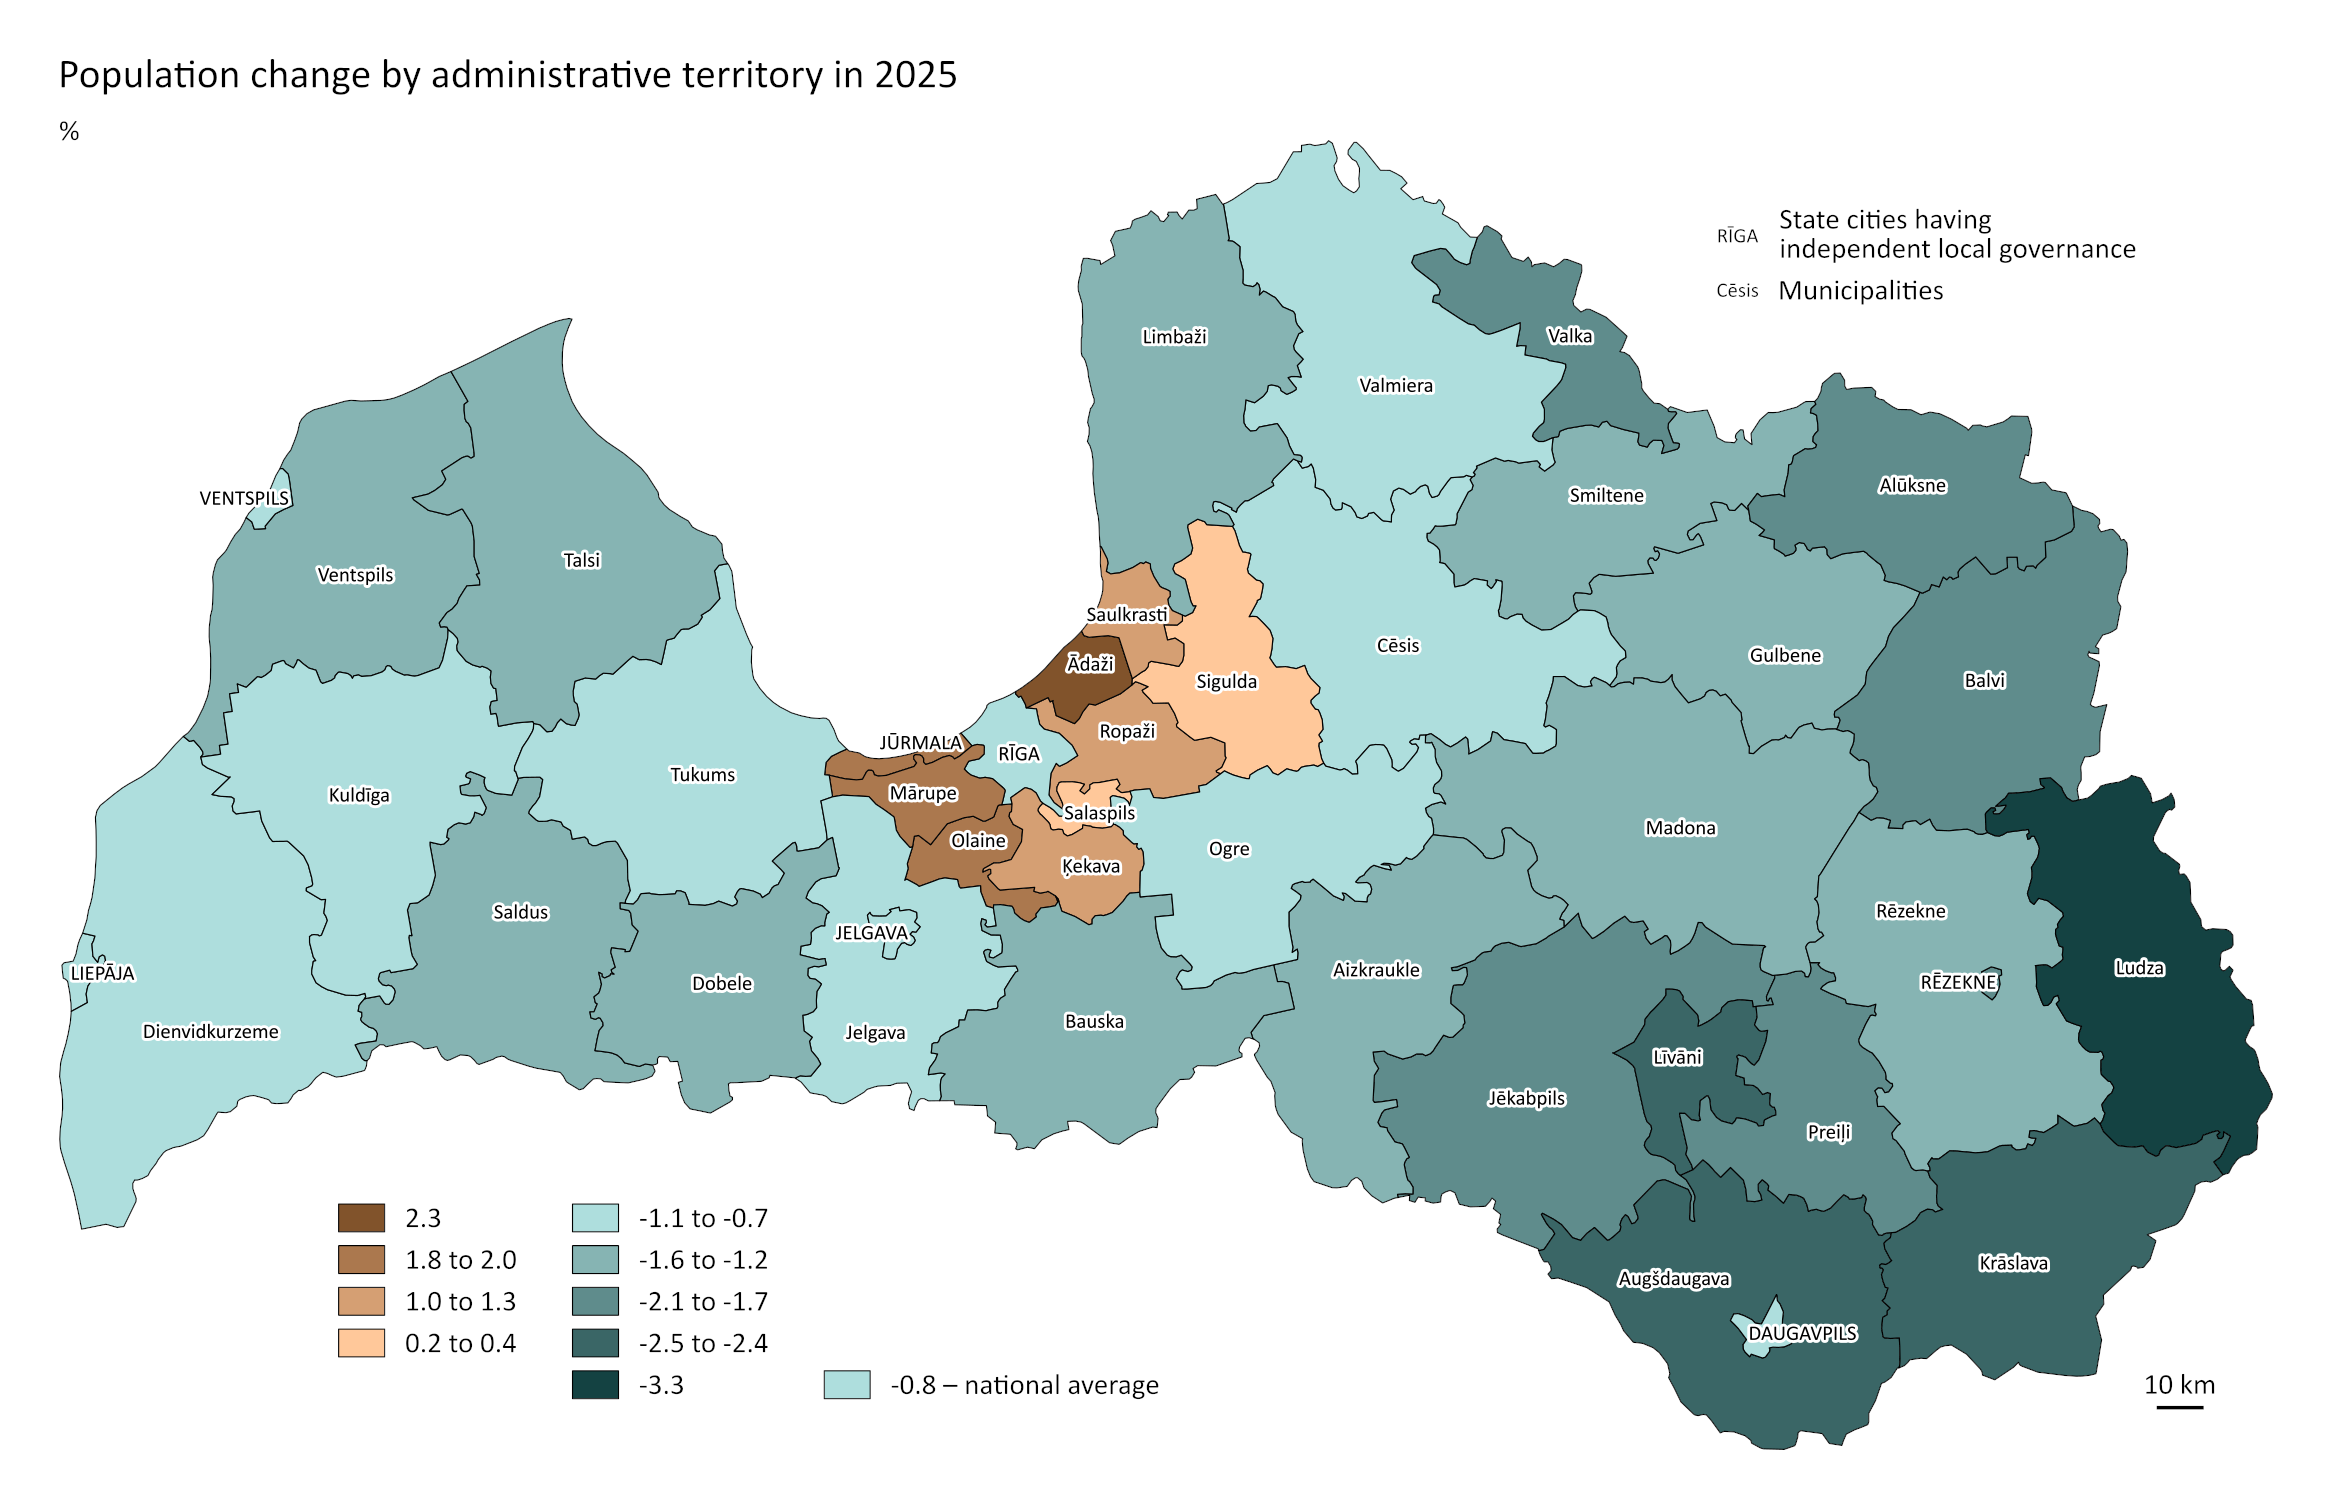
Population growth recorded in seven municipalities in Riga region and one municipality in Vidzeme region
In 2025, Latvia had an urban population of 1 million 288 thousand people (i.e., 69.8 % of the total population lived in cities) and rural population of 557 thousand people (30.2 % lived in rural areas). Almost half (46.0 %) of all inhabitants lived in Riga region, and 589 thousand – 31.9 % of the total population and 45.7 % of the urban population – lived in the capital, Riga.
In terms of regions, 235 172 inhabitants lived in Latgale (down by 1.8 % or 4.2 thousand compared with 2024), 271 669 in Kurzeme (down by 1.1 % or 3.1 thousand), 219 191 in Zemgale (down by 1.2 % or 2.7 thousand), 271 223 in Vidzeme (down by 1.0 % or 2.8 thousand), and 847 841 in Riga region (down by 0.3 % or 2.6 thousand).
In terms of population size, Ogre with 57.2 thousand and Valmiera with 50.3 thousand inhabitants are the largest municipalities. Tukums municipality with 43.0 thousand inhabitants, Cēsis municipality with 41.0 thousand, and Bauska municipality with 40.0 thousand are the largest municipalities which do not include State city in their territory. Whereas Valka with 7.5 thousand and Līvāni with 9.9 thousand inhabitants are the smallest municipalities.
In 2025, population growth was recorded in seven municipalities in Riga region – Mārupe, Ādaži, Ķekava, Olaine, Ropaži, Salaspils, and Sigulda – and one municipality in Vidzeme region – Saulkrasti. The highest population growth was registered in Mārupe municipality (up by 2.0 % or 762 people). Mārupe and Ķekava municipalities had both positive net migration and positive natural population change, while Ādaži, Olaine, Ropaži, Salaspils, Sigulda, Saulkrasti and Valmiera municipalities had positive net migration.
Jūrmala was the only State city where population increase was registered last year (up by 1.8 % or 925 people). The rest of the State cities witnessed population decline: Rēzekne of 1.7 % (451 people), Jēkabpils of 1.6 % (329 people), Ogre of 1.1 % (258 people), Riga of 1.0 % (6.1 thousand people), Liepāja of 1.0 % (675 people), Daugavpils of 0.8 % (640 people), Jelgava of 0.8 % (426 people), Ventspils of 0.8 % (244 people), and Valmiera of 0.3 % (66 people). Immigration exceeded emigration in Jūrmala, Daugavpils, Valmiera and Ventspils, however all State cities recorded negative natural population change.
Refer to the OSP database: IRS031 and map viewer
Population and births declined in all three Baltic states
At the beginning of 2026, Lithuania had a population of 2.888 million (down by 3.1 thousand people or 0.1 % year on year). Population of Estonia declined by 9.3 thousand or 0.7 % and stood at 1.361 million.
Lithuania registered a total of 17.6 thousand newborns (down by 1.4 thousand or 7.6 % compared with 2024), and Estonia had 9.2 thousand births (down by 450 or 4.6 %).
Source: Statistics Estonia website and Statistics Lithuania website
Information on population in administrative territories at the beginning of 2026 as well as the key demographic indicators are available in the official statistics portal, section Population.
Methodological information
1 Since 2025, CSB has been estimating usually resident population of Latvia using a new method, based on the SoL-logit model. This model is an unsupervised machine learning approach comprising two components: a logit component, which estimates the probability that a person is a usual resident of Latvia, and a SoL (signs of life) component, which measures activity of an individual in selected administrative registers.
Latvia is one of the first European Union countries to produce population estimates from administrative data using a relatively complex method that integrates signs of life with logistic regression. The new method improves the accuracy of population and migration estimates, supports the production of detailed annual data from administrative sources, and reduces response burden and costs.
2 A long-term migrant is a person who moves to another country for at least one year or permanently. To determine whether a person is actually living in Latvia or abroad, CSB uses data from the Register of Natural Persons and other administrative registers, assessing activities of a person, or signs of life, recorded in health care, education, social assistance, employment and other state information systems.
3 The number includes citizens of Ukraine the residence whereof was registered in Latvia at the beginning of the respective month, who have a residence permit for at least 11 months, and who have been granted a temporary protection status.
Natural population change (natural increase) is the difference between the number of births and the number of deaths in a given period.
Net migration is the difference between the total number of persons arriving in the country for permanent residence for at least one year and total number of persons departing from it for permanent residence or for at least one year.
Media requests:
Public Relations Section
Email: media@csp.gov.lv
Phone: +371 27880666
More information on the data:
Ance Ceriņa
Social Statistics Department
Email: Ance.Cerina@csp.gov.lv
Phone: +371 67366904
Share